Subsection 5.18.4 Results
The results section should present the findings of your experiment without interpretation. This section often includes figures or tables, figure captions, and the important results presented in paragraph form. For biology, figure captions should include sufficient detail that the figure would make sense without the context of the results section. For chemistry, the caption should include enough information that a reader can understand the figure but it does not need to stand alone. One of the most challenging parts of a results section is deciding which results to present in paragraph form. Focus on the most important trends or findings for answering your research question. Present these results as clearly as possible, using references to figures and results of statistical tests to back them up. The content and style of results sections is similar between biology and chemistry. However, watch out for differences in formatting for figures, tables, and figure captions.
Example 5.18.20. Results: Biology.
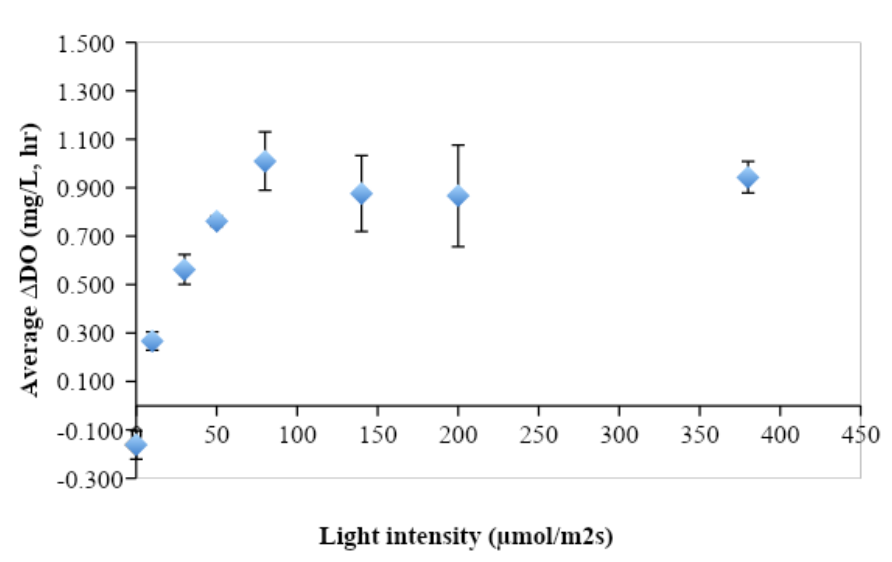
The lowest light intensity (0 \(\mu\text{mol photons m}^{-2}\text{s}^{-1}\)) showed the lowest and only negative average change in dissolved oxygen (\(\Delta\text{DO}\)), at \(-0.162\pm0.058\) mg/L-hr (Figure 1). At light intensities of 10 and 30 \(\mu\text{mol photons m}^{-2}\text{s}^{-1}\) the \(\Delta\text{DO}\) increased from \(0.267\pm0.038\) to \(0.562\pm0.062\) mg/L, hr for a 53% increase in average \(\Delta\text{DO}\text{.}\) From light intensities 30 to 50 \(\mu\text{mol photons m}^{-2}\text{s}^{-1}\) the average \(\Delta\text{DO}\) increased 11% (to \(0.562\pm0.062\) to \(0.762\pm0.021\) mg/L, hr). The standard errors of average \(\Delta\text{DO}\) for light intensities 0 to 50 fell between .04 to .06 without any overlap, and thus were all statistically different from one another. There was a notable increase (over 200%) in \(\text{O}_2\) production from light intensity 0 to 80 \(\mu\text{mol photons m}^{-2}\text{s}^{-1}\text{,}\) and a generally positive relationship between light intensity and \(\Delta\text{DO}\) from 0 to 80 \(\mu\text{mol photons m}^{-2}\text{s}^{-1}\text{.}\) \(\Delta\text{DO}\) plateaued after 80 \(\mu\text{mol photons m}^{-2}\text{s}^{-1}\text{.}\) The \(\Delta\text{DO}\) at light intensities 80, 140, 200, and 380 \(\mu\text{mol photons m}^{-2}\text{s}^{-1}\) were not statistically different from each other, and ranged from 0.7 to 1.1 mg/L, hr (including overlapping standard error).
This paragraph lays out the notable results, reporting numeric values and trends. One strength of this example is that in addition to raw number values the author reports percent increase between groups, which gives a clearer sense of the magnitude of change. They also focus on important trends and leave out details that are less important to interpreting the results, like the individual values of \(\Delta\text{DO}\) at the high light intensities. Simply listing data in a results section is not an effective way to communicate results. Results sections do not include any interpretation of what results might mean, leaving that for the discussion. Figures are referenced parenthetically, and the written section appears before the figure it references. If results from statistical tests (like a t-test or ANOVA) were reported, they should be in parentheses as well.
Figure 1 Increasing light intensity causes an increase in Elodea canadensis photosynthetic activity up to 80 \(\mu\text{mol photons m}^{-2}\text{s}^{-1}\text{.}\)
Samples of dark-adapted Elodea canadensis in diluted sodium bicarbonate solution were introduced to a bank of lights at varying light intensities for 90 minutes, and change in the dissolved oxygen value (mg-\(L^{-1}\)) of the sodium bicarbonate solution was measured as a marker of photosynthetic activity. From light intensities of 10 to 30 \(\mu\text{mol photons m}^{-2}\text{s}^{-1}\) the average \(\Delta\text{DO}\) increased by 53%. From light intensities 30 to 50 \(\mu\text{mol photons m}^{-2}\text{s}^{-1}\) the average \(\Delta\text{DO}\) increased by 11%. There was a notable increase (over 200%) in \(\text{O}_2\) production from light intensity 0 to 80 \(\mu\text{mol photons m}^{-2}\text{s}^{-1}\text{.}\) \(\Delta\text{DO}\) plateaued after 80 \(\mu\text{mol photons m}^{-2}\text{s}^{-1}\text{.}\) Elodea canadensis shows the most efficient use of light energy for \(\text{O}_2\) production at 80 \(\mu\text{mol photons m}^{-2}\text{s}^{-1}\text{.}\)
The details of good figure design are beyond the scope of this chapter, but a well-designed figure should clearly convey the important trends in the data. Looking at figures and figure captions is one of the first things people do when reading a scientific paper, so figure captions should include enough information that they make sense to someone who hasn’t read the rest of your results or methods. Make sure the caption states what important biological takeaways a reader should get from the figure. This means there will be some repetition: notice how this caption mentions some of the same things as the results without repeating them exactly. It also includes a quick overview of the methods used to produce these data. For a lab report with multiple figures, each caption should only reference methods and results pertaining to that figure.
Example 5.18.21. Results: Chemistry.
The mass of the Erlenmeyer flask, stopper, and air within it was measured to be 143.6151g, and the calculated mass of the air within the flask was 0.31034g. Subsequently the mass of the empty flask (flask with air and stopper mass minus the air mass) was found to be 143.3053g. The volume of water that filled the flask was measured to 265 mL, so the volume of the flask was said to be 265 mL, or 0.265 L.
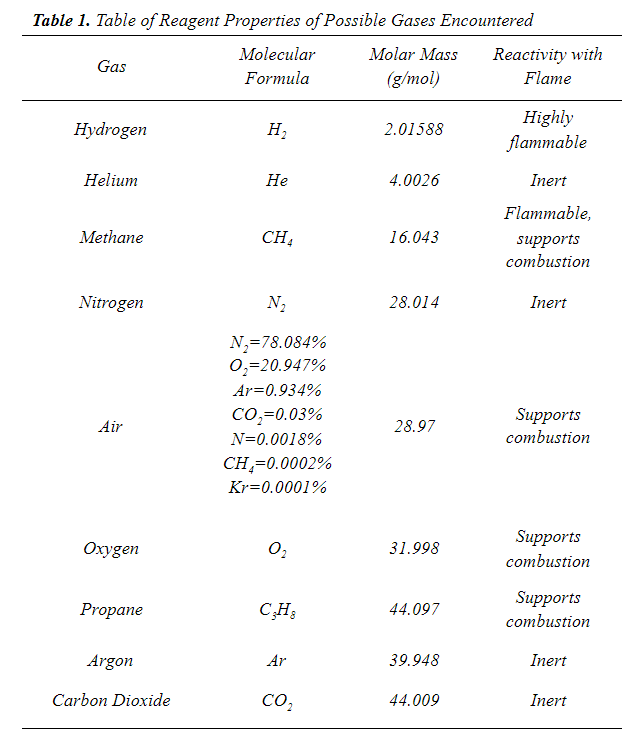
Table 1 gives reagent information about all the gases that could have been encountered in the experiment. Each gas was a possibility for the identity of the unknown gases.
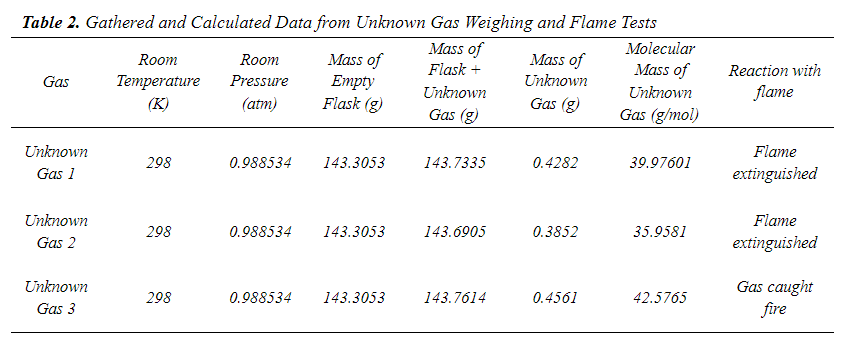
Table 2 summarizes the data measured and calculated about each unknown gas, as well as the results of their reaction with a flame.
The mass of the sample of Unknown Gas 1 was 0.4282g. Using this, the molar mass of the gas sample was found to be 39.97601 g/mole. The mass of the Unknown Gas 2 sample was 0.3852g, and the molar mass of the gas sample was then found to be 35.9581 g/mole. The Unknown Gas 3 mass was 0.4561g, and the molar mass of the gas sample was calculated to be 42.5765 g/mole (see appendix for calculations).
The hypotheses for each unknown gas’s identity were supported by the flame test results, except for Unknown Gas 1. The gas was confirmed to be inert by the flame test, yet to narrow the gas’s identity possibilities down to one, further testing was needed. Unknown Gas 1 was subjected to the limewater test. The \(\text{Ca(OH)}_{2(aq)}\text{,}\) when added to the gas in the flask, formed a whitish grainy precipitate in the liquid.
This results section presents results without interpretation. The text is used to present important results which may also be listed in figures or tables. In this example, the important results to emphasize are the ones that were used to identify the unknowns. Many projects in college chemistry involve identification or synthesis, so the results might not always translate to visually interesting graphs. However, if you draw out the important clues that lead to your conclusions, you can build dry numerical results into a compelling narrative. This results section is written in past tense passive voice, which is standard for chemistry.
Detailed results are presented in tables. The tables should be numbered, have concise, unambiguous titles, and have clear column headings that include units when relevant. For table 2 in this example, units are included except for ‘gas’ and ‘reactivity with flame.’ When presenting lots of numerical results, be sure to use consistent and appropriate numbers of significant figures. Formal tables use only three horizontal lines and no vertical lines. While this example does not include a figure, figures should also be numbered sequentially and have short captions describing the data they present. Figure captions for chemistry are usually shorter than for biology and should describe but not interpret the figure. Captions for figures and tables often include information about how the data was collected, which is less common in biology. However, the figure and its caption should still be able to stand alone. Figures and tables should be referenced in the text of the results section, either directly (ie. “Table 2 summarizes the data measured and calculated about each unknown gas, as well as the results of their reaction with a flame” from the above example) or parenthetically (ie. “The mass of the sample of Unknown Gas 1 was found to be 0.4282g (Table 2).”). Check with your instructor for specifics of formatting and examples of figures and tables.